


info@gerb.com
Damping Technologies for tall Buildings: Comfort and Safety
Council on Tall Buildings and Urban Habitat (CTBUH) Damping System Guidelines
Thyssen Krupp Test Tower, Rottweil/Germany
Project Data
- Year of Completion:
2016(topped out) - Developer/Contractor/Owner:
Krupp Hoesch Stahl GmbH / Thyssen Krupp Elevators - Architectural Designer:
Werner Sobek with JAHN Architects Stuttgart and Chicago - Structural Designer:
Werner Sobek Stuttgart - Damping Supplier:
GERB Vibration Control Systems - Testing Laboratory:
Wacker Ingenieure (Wind Engineering / Wind Tunnel Tests) - Height / Interstory Height:
246 m / 3.3 m (Office Space) - Slenderness Ratio:
1/11.8 - Stories:
27 Levels / 8 Stories Office Space - Gross Area of the Tower:
340 square meters - Building Function:
Elevator Test Tower / Offices / Observation Platform ( 232 m) - Structural Material:
Reinforced Concrete (C50/60) / PTFE Membrane Façade on a steel structure - Structural System:
Cantilevered Reinforced Concrete Core on a Raft Foundation
(- 32 m) - Damping Strategy Utilized:
Hybrid Mass Damper System (240 t)

1.0 Introduction/History
A 246m tall tower has been erected in South West Germany with the purpose to accommodate a testing facility for elevator innovations. The tower has a circular footprint with a diameter of 20 m and provides space for 9 testing elevator shafts, a fire service elevator and a glass panorama view elevator. In addition a 220m shift is provided to be used as mechanical lifting shaft to ensure the test programs.
The tower base has a diameter of 40 m to provide additional space for service facilities, a lobby and an education center. At a level of 232m an observation platform – Germanys highest – allows a spectacular view to the Black Forest and even the Alps on clear days.

2.0 Structural System
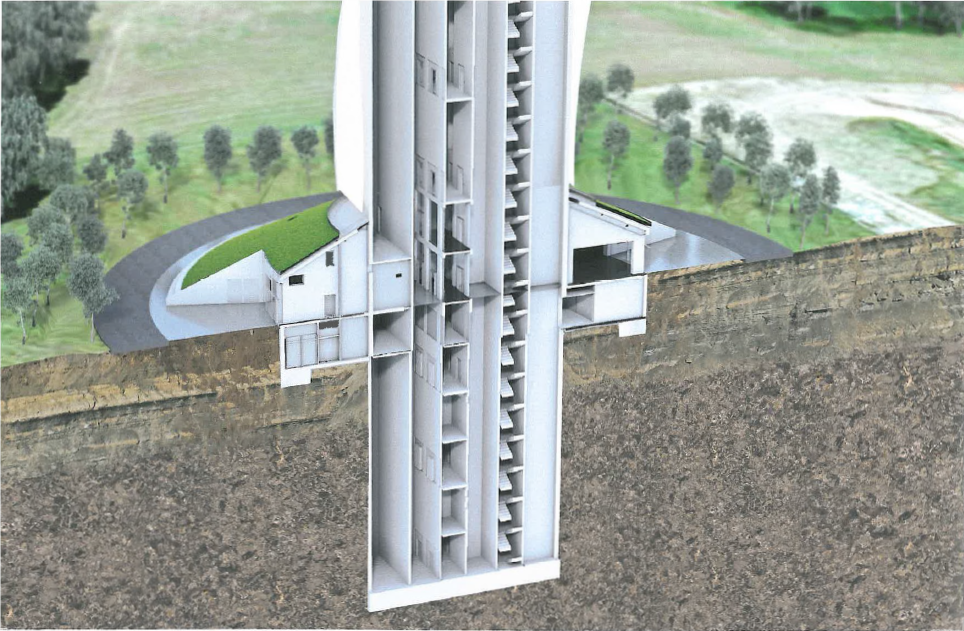
The structural system of the Test-Tower is basically a reinforced concrete tube with a diameter of 20.8 m that is clamped 30 meters into the surrounding soil (see Figure 2).Up to a level of 110 m the tube has a thickness of 40 cm and above of 25 cm.The soil, consisting of a Keuper layer and subjacent shell lime stone, provides a high bearing capacity so a pile foundation was not required. In addition to the clamping by the surrounding soil, the wider tower base structure provides additional lateral stiffness.
The internal stiffening of the concrete tube results mainly from the inner walls of the elevator shafts. Only at certain height levels prefabricated ceiling slabs were installed to allow an access to the lift shafts. Some of the lift shafts end at a level of 115 m and are covered by 40 cm thick long span floors which were casted in place. These floors are used for office space. Above a void space up to a level of 197m is used as a heat reservoir and for the TMD system. The top of the tower is used for office space and for the remaining lift shafts.
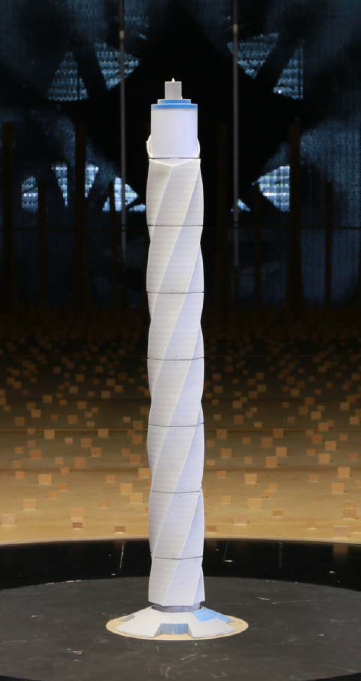
A distinctive feature of the Test-Tower is the textile façade which consists of a PTFE coated glass-fiber mesh. The aperture width of the mesh increases with the height of the building to increase translucency of the façade, decrease the density and weight of the material and for aerodynamic effects.
The spiral shape of the facade is meant to function as a Scruton spiral and the fabric itself helps to shade the concrete structure to avoid thermal induced stresses due to solar radiation. For the façade design and the choice of material aspects of the installation, the maintenance and durability as well as the wind loading had to be considered.
3.0 Construction Method
The construction of the Test-Tower was done in the following steps:
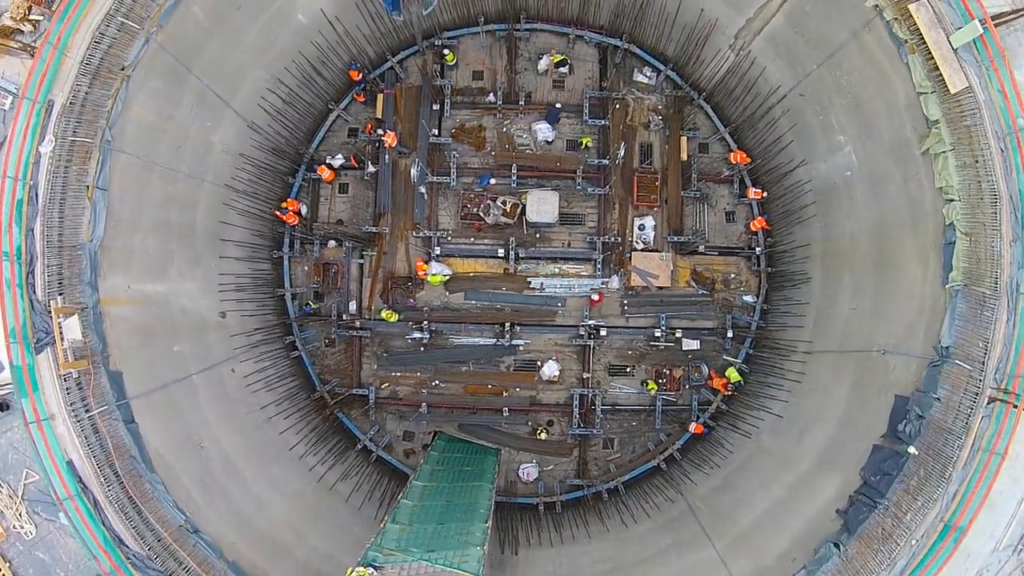
- Excavation of a 30 m circular construction pit for the tower base. The excavation and the shape were achieved by an initial blast. After the excavation, the pit was secured with ground anchors and shotcrete lining.
- Pouring of the raft foundation
- Construction of the vertical concrete structure using slip forming. All walls were constructed continuously for a period of 4 months
- Construction of the floor slabs
- Construction of the entrance area.
4.0 Predicted Dynamic Response to wind loading
The fundamental frequencies for the Test-Tower were predicted to be in range of 0.17Hz – 0.20 Hz seconds depending on the construction stage and state of the concrete (cracked/uncracked) – see Figure 4.
The wind analysis revealed that resonant excitation of the structure can occur at wind speeds which correspond to ground values (height 10m) in the range of 55 – 60 km/h. It was expected that without additional damping this resonant excitation would cause top deflections of about +/- 750 mm which would not only cause discomfort for the occupants but would also have significant fatigue life implications for the concrete structure of the tower (see Figure 5 ). To reduce the dynamic response to cross wind excitation, a passive Tuned Mass Damper System was implemented. Since the tower shall be used as a test tower for building sway sensitive elevator equipment, the owner was looking for a possibility to
artificially excite the tower on calm days, though with displacements that would not cause any fatigue issues. The requested level for the artificial sway motion was in the considered safe range of approximately +/- 200 mm. This request gave the rare opportunity to implement a Hybrid Mass Damper (HMD) or, since the design system deviates from other HMD systems that were introduced in the past, a so called Dual Use TMD. The system shall be presented in the following chapters, including the optimization of the passive system, the design of the actuators’ mechanism, control algorithms and the safety concept.
5.0 Optimization of the passive Tuned Mass Damper System
The parameters of the passive TMD system had to be determined considering three different aspects a) to provide sufficient additional structural damping in order to reduce the dynamic response owing to vortex shedding excitation, b) to limit the resulting TMD main mass travel in the passive mode, to an attainable/practical value, for when under gust cross wind excitation and c) to choose the TMD mass according to the energy input that is required for the desired maximum tower deflection in the excitation mode, considering the performance envelope enabled by the provided actuators
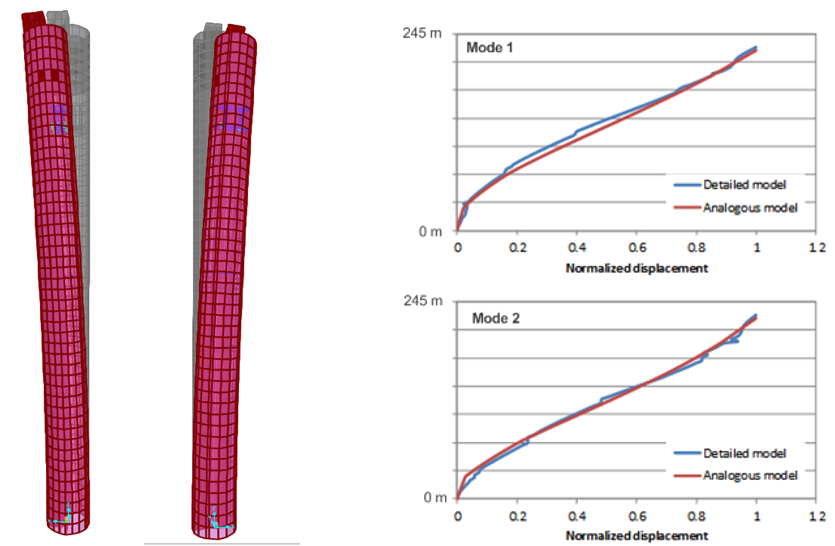
(i.e. maximum force generated and maximum stroke during operation). To optimize the TMD system a numerical model was used that represented the mass distribution of the tower, and mass moments of inertia as reported in the identified structural properties. The stiffness elements between the floors were also tailored to match the mode shapes and natural frequencies from full-scale observations. Fig. 6-left shows the mode shapes and natural frequencies of this employed analogous model. Fig. 6-left also compares the mode shapes of the analogous model against these of the detailed model prepared by the structural consultant.
In addition, the TMD has been discretely modeled as a pendulum system capturing also its eccentric position at the tower. The load characteristics for the governing input case, i.e. resonant excitation due to vortex shedding, are very alike to that of a single harmonic excitation. Yet, the co-existing gust loading is inherently of stochastic nature and for it, optimization criteria other than the well known Den Hartog criterion apply. In addition, the relative displacements of the TMD mass are bigger for a stochastic than for a harmonic type loading. Since for the numerical determination of the optimum TMD parameters a close to reality loading should be considered, a time history was generated that included both the stochastic gust loading (based on the Davenport Spectrum) and a superimposed resonant, vortex shedding like, component for representing the overall cross wind excitation (see Fig. 3-right). The tower deflection reduction that can be achieved with the optimized passive TMD system as well as the resulting TMD displacements are shown in Fig. 3-right.
Based on these results for an estimated inherent structural damping of ξ=0.8 %, it was determined that a TMD mass of 240t was required to keep the displacements within +/- 650 mm while maintaining an optimum TMD damping ratio for the best TMD performance. An increase of the TMD damping could have reduced the travel while the efficacy would still have been sufficient but this would have adversely affected the actuator force requirements. To determine the required forces for the optimum 240 t TMD setup the analogous model has also been used to verify that, with a maximum force of 40 kN from the actuators, tower deflections can be achieved in the range of +/- 200 mm. Fig. 4 shows the results of a time domain numerical simulation on the analogous numerical model; for this the resulting tower top deflections, the TMD mass deflections and the input active forces that cause them are displayed.
6.0 Description of the control system
The duality of the control system serves a) the purpose of an reduced energy consumption, while in normal passive operation, to reduce the occurring vibrations b) the purpose of reduced force requirements for the actuators, by using resonance effects in order to excite the main TMD mass for ultimately achieving the actual force demand. So, compared to other control systems (see Fig. 1) the actuators connect the main structure and the TMD mass but are not used to control the TMD mass directly as it would be the case for a typical Active Mass Driver/Damper system.
For the implemented Dual Use TMD a reaction mass for the passive operation of 240 tons was chosen. For the excitation operation mode two linear drives – one in each principal direction- are attached to the TMD mass with pivots near the center of gravity of the mass to avoid any torsional artefacts. Each linear drive can provide forces up to 40 kN within a stroke of max. +/- 600 mm (see detail Fig. 2). The linear drives can be detached so that the entire passive mode will not be influenced by the bearings of the actuators for the unlikely event of a bearing failure.


Figure 10 – Types of Control Systems – Dual Use TMD compared to passive, semi-active, active and hybrid systems
The system is instrumented with four uniaxial accelerometers (seismic K-Beam/MEMS; one in each direction) to determine the tower top level and the TMD mass accelerations. The acceleration signals are getting bandpass filtered inside the frequency range of the towers fundamental natural frequencies (0.1 – 0.3 Hz) and integrated to give the tower velocities and deflections.
In addition, the integrated displacement values can be compared against the ones of a complimentary Global Navigation Satellite System installed also at the top to compare for signal drifts. An initial correlation tests was performed accordingly. Furthermore, the TMD displacements are monitored directly with string pot transducers and an inductive length measuring system integrated within the linear motors.
7.0 Control algorithm
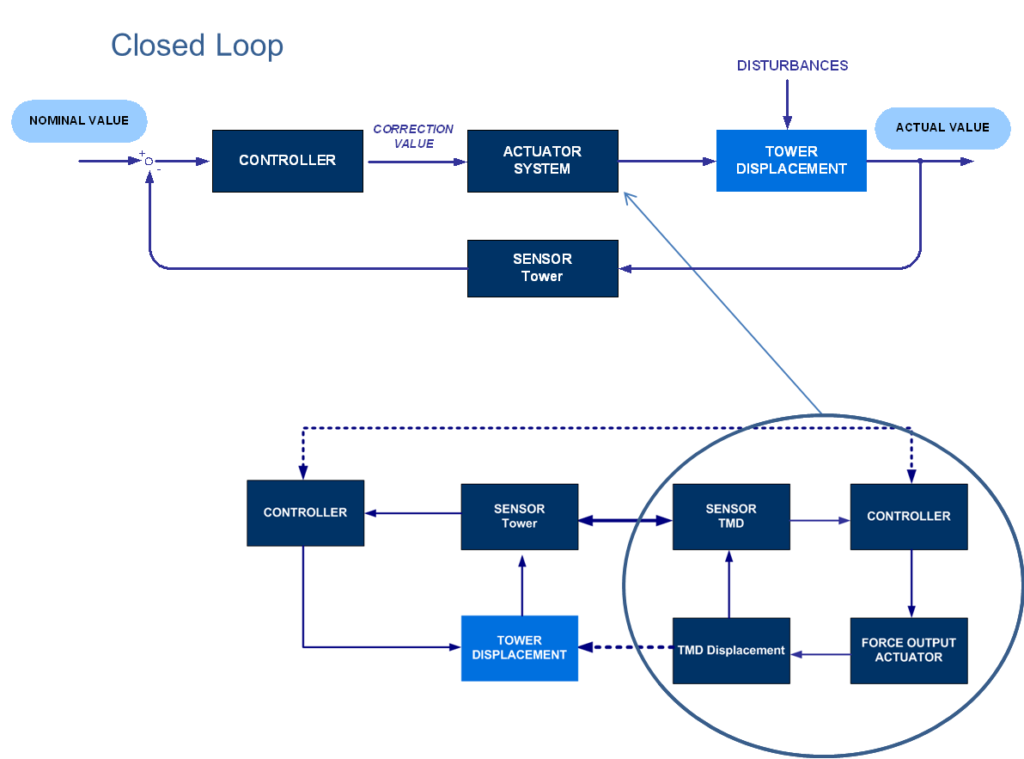
The general control loop for the tower is shown in Fig. 5 which illustrates the closed loop control sequence. A detailed design of the control algorithm would require analytical models of the actuators-TMD mass interaction to determine the connection between actuator input to applied action force. These should combine with the analytical model of the main structure that describes the overall building dynamic behavior. Further, compared to standard control algorithms that were applied to other HMD applications as in [2],[3] or theoretically investigated as in [1] the control algorithm for this tower application had to consider synchronous controlled excitation in one main direction and vibration reduction in the perpendicular direction. Since the dynamic response is majorly expected in the fundamental modes, linear feedback control with all its benefits to avoid instabilities could be applied for both these tasks. For the simple control realization practiced, the linear feedback control, that attenuates the towers dynamic response perpendicular to the excitation, drives the relevant actuator through a specified weighted linear sum of seven structural dynamic measurements. These measurements are: TMD and tower top accelerations, TMD and tower top velocities, TMD and tower top displacements, and TMD to tower top relative displacement.
It is important to note that the preselected weighting factors are simple, positive or negative scalar gains. The parametrization of the weighting factors is based on the dynamic tests of the tower and are not using any frequency dependent modification. The active actuator feedback is calculated instantaneously (at 50Hz), and it is again a linear combination of the previous dynamic measurements. There is no nonlinear manipulation being used. The control design was also implemented in a time domain numerical simulation (i.e. direct integration) to evidence the performance of the actuator control vibration mitigation. For the excitation mode the same control approach has been used in combination with a displacement offset that represents the excitation of the tower to the desired displacement value. The offset is a sinusoidal function based on the detected fundamental frequency of each direction. The control output to counteract the variation of the top displacement due to other disturbances is then modulated on the sinusoidal offset function and the control value is adapted accordingly.
The linear feedback control for reducing the towers dynamic response perpendicular to the excitation allows the force command to the actuator to be a specified weighted linear sum of the seven dynamic measurements of the program. The seven measurements are: TMD and tower acceleration, TMD and tower velocity, TMD and tower displacement, and TMD to tower relative displacement. It is important to note that the weighting factors are simple, positive or negative scalar values. The parametrization of the weighting factor is based on experimental dynamic tests of the tower. The actuator feedback is active is calculated instantaneously (50Hz)
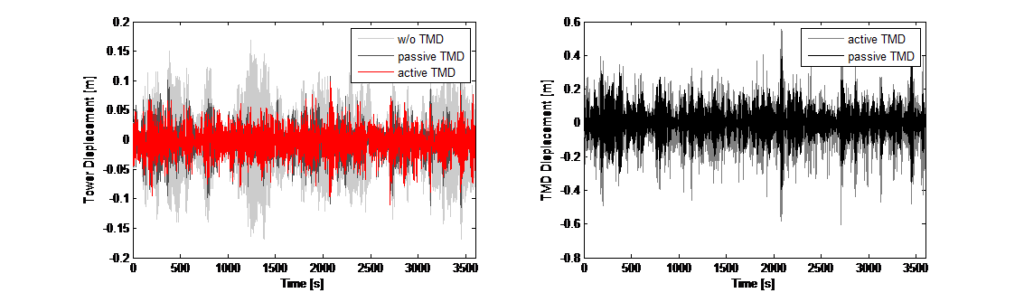
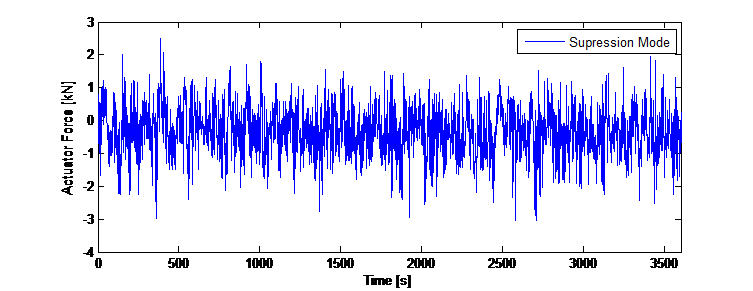
and the weighting factors are scalars they are not using any form of frequency dependent transfer function. Also, the feedback is a linear combination of the dynamic property. There is no nonlinear manipulation or logic being used. The control design was implemented for a numerical simulation in the time domain (direct integration) so for each time step the force input to the TMD mass as actuator control could be adapted. Figure 12 shows the results from the simulation for vibration suppression – the tower displacements and the resulting travel of the TMD mass.
For the excitation mode the same control approach has been used in combination with an offset that represents the excitation of the tower to a desired displacement value. The offset is a sinusoidal function based on the detected fundamental frequency for each direction. The control output to counteract the variation of the top displacement due to the disturbance is then modulated on the sinusoidal offset
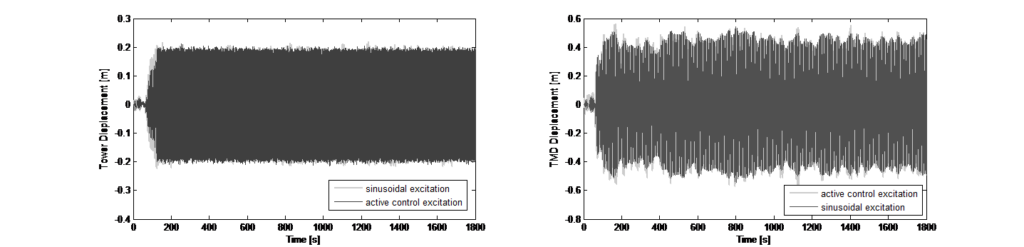
function and the control value has to be adapted accordingly. For this offset a weighting factor was experimentally determined. Figure 13 shows the numerical results with gust load disturbance for the excitation mode with a simple sinusoidal excitation and with applied control algorithm.
8.0 Safety concept
Considering the force of +/- 40 kN that can be provided by the linear drives that are used as actuators, a safety concept to ensure that the tower displacements do not exceed the fatigue provisions is indispensable. This applies even though the force output is not sufficient to cause top deflections larger than the predetermined +/-200 mm. One approach to enhance the safety of the system was to increase the redundancy of the monitoring sensors which are recording the tower’s top deflection. This can be best achieved by implementing an additional independent monitoring system that ideally uses a different measuring principal than the actual control hardware. For the herein presented project, the control hardware used, as quoted, accelerometers and a defined acceleration threshold for signal band-pass filtering within the range of the structure’s relevant natural frequencies. The overriding superordinate monitoring system is a Global Navigation Satellite System (GNSS) with an accuracy of +/- 10 mm.
The GNNS system requires a reference base station, which is processing the coordinate data to the actual displacement response values. If the tower’s top displacement exceeds a predetermined threshold during the artificial excitation mode, which could owe to additional wind or other excitation, a relay will switch the attendance signal to 0V. This will cause aborting the excitation mode. In addition, both monitoring systems are constantly checking the acquired data for faulty sensor signals which will also result in aborting the active excitation mode. The faulty acceleration/string pot signals will be detected by a spectral peak picking criterion – only if peak picking in a relevant range is possible it can be assumed that the sensors provide legitimate signals. While the GNNS system analyzes the change of the coordinate data, if the sampled data do not timely change, a faulty signal is automatically assumed.
9.0 Vibration Tests
Initial vibration tests of the tower were performed at the current stage where the tower is not completed yet so the fundamental frequencies of the tower at this stage are above the specified tuning range of the passive TMD system. The TMD is adjusted to the highest possible tuning frequency. Objective of the vibration tests was the determination of the fundamental frequencies of the tower with blocked TMD system as well as the inherent structural damping. In addition the dynamic behavior with engaged passive TMD system should be determined as well as the increase of structural damping due to the passive TMD system. To identify the fundamental natural frequencies of the tower the Averaged Normalized Power Spectral Density (ANPSD) Method [1] can be used. For this, the recorded time histories have to be separated into segments. These segments have to be transformed into the frequency domain. The resulting spectra need to be normalized, averaged and multiplied with the complex conjugated spectra.
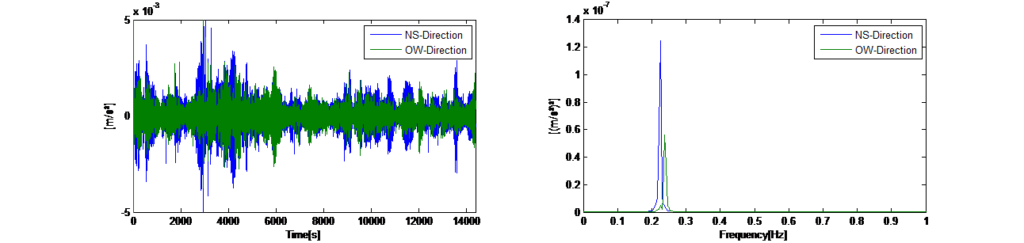
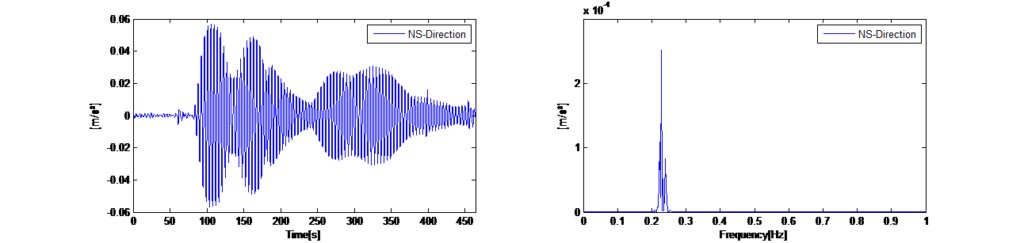
By doing so, all random vibration will be eliminated and only the recurring free vibrations of the structure will be displayed in the averaged spectrum, which now represents the dominantly excited natural frequencies of the tower. Figure 14 left shows the recorded time histories of the horizontal ambient vibrations in x- and y- directions with locked TMD. Figure 14 right shows the resulting averaged Auto Power Spectra for a segment length of 120 seconds. The spectra show that the tower shows a dynamic response at two dominant frequencies (0.225 Hz in x-direction and 0.245 Hz in y-direction).
Further to the above described Averaged Power Spectrum Method – which assumes that the ambient excitation causes a sufficient dynamic response in the vibration modes of interest to gain stochastic security- the natural frequencies were determined using the commercial signal processing software ARTEMIS [1] which incorporates Enhanced Frequency Domain Decomposition and Stochastic Subspace Identification Methods.
The Enhanced Frequency Domain Decomposition (EFDD) and the Stochastic Subspace Identification are widely used techniques for output-only modal parameter identification.
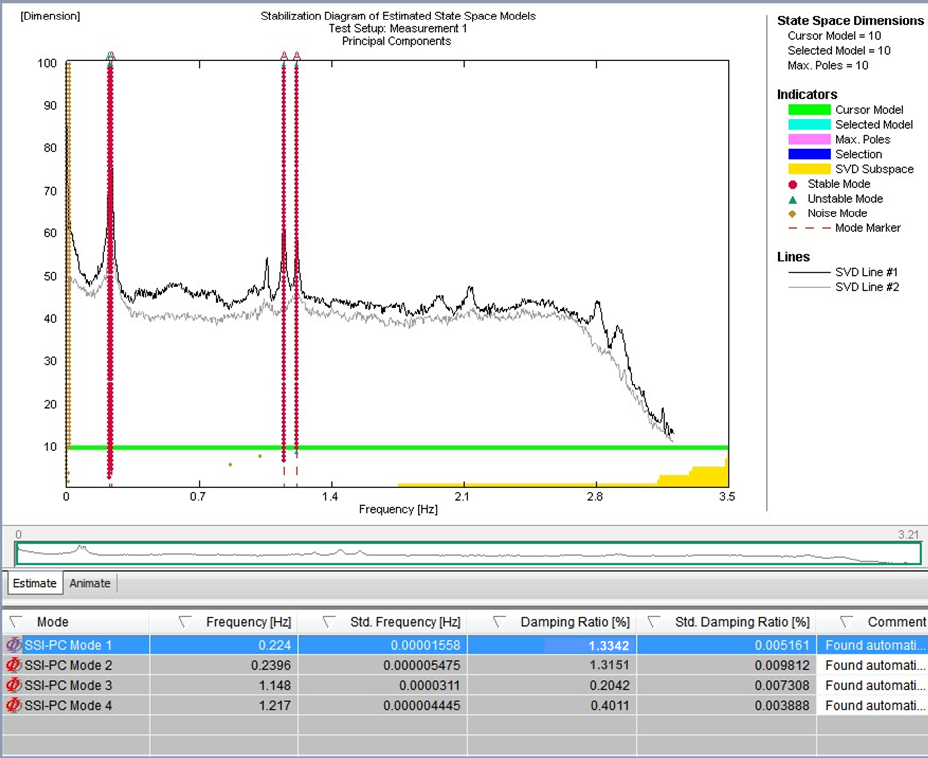
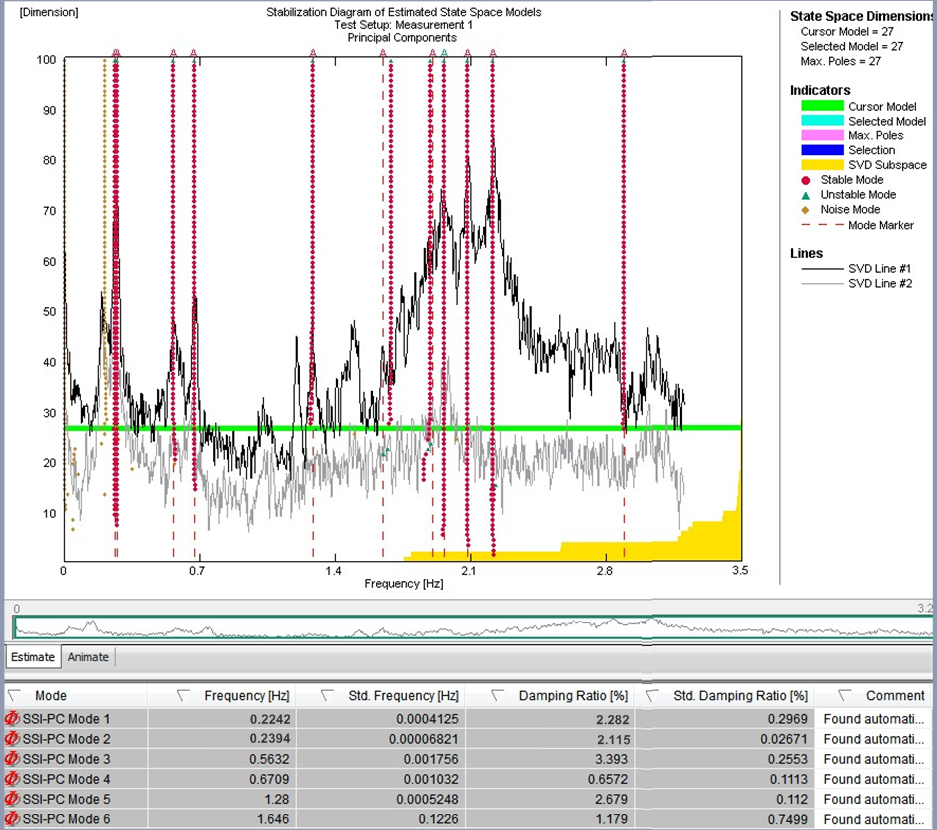
Figure 15 – Stability Cards for the ambient vibration record with blocked TMD (left) and activated TMD (right)
The EFDD method relies on computation of response spectra. Long records are, therefore, required to keep low the error on spectrum estimation and to extract modal parameters in a reliable way. The stochastic subspace identification algorithm was applied to identify bridges using an output–only model. Stochastic Subspace Identification methods work in time domain and are based on a state space description of the dynamic problem. The system identification results at different model orders are compared to distinguish true structural modes from spurious modes in so-called stabilization diagrams. These diagrams are a popular way to select the identified system model, as the true structural modes tend to be stable for successive model orders, fulfilling certain stabilization criteria that are evaluated in an automated procedure. Figure 15 shows a resulting stability card for recorded ambient data, from which the relevant modes could be determined. The identified modes and the determined damping ratios for each mode in the state with locked TMD (left) and the engaged TMD (right) are shown in Figure 14 as well. An increase of the structural damping can be noticed. The additional structural damping is in range of a theoretical value that can be determined from the theoretical model for which the detuned TMD setup was considered.
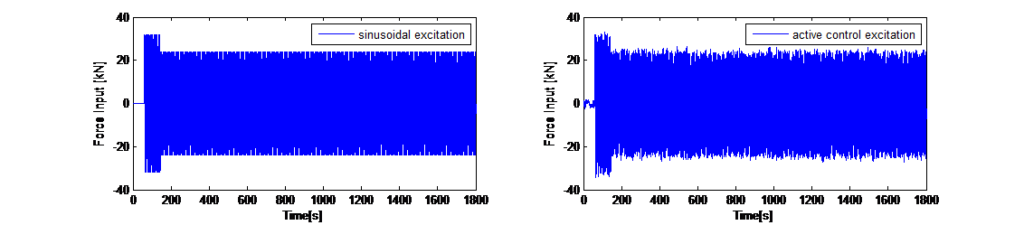
In addition to the ambient vibration tests with the passive TMD system, preliminary tests with the active excitation mode were performed despite the detuned state of the TMD system. Figure 12 left shows the time history of the recorded accelerations at the tower top. After an initial sinusoidal excitation the algorithm for a steady acceleration level was enabled to experimentally determine the correlation between tower deflection and forced displacement of the TMD mass. The time history shown in Figure 12 displays the two test scenarios in the excitation mode and the corresponding FFT spectra shows the clear response of the tower in its two fundamental frequencies (x- and y- direction). The green marked time section is a sinusoidal excitation of the mass with disabled active control which caused a dynamic response in both main directions. The resulting FFT spectrum displays the two peaks to identify the fundamental frequencies in these two directions. The blue marked time segment is for an excitation with enabled active control which caused a more steady tower displacement dominantly in one direction. The resulting vibration decay after the excitation mode was switched off was also used to determine the structural damping and determined to be D=2.4%. This result correlates with the damping ratio determined with the SSI algorithms.
10.0 Conclusion and Outlook
A Dual Use TMD has been installed at the 246m tall Thyssen Krupp Test-Tower with the objective to purposely excite the tower to a controlled dynamic response in its fundamental frequencies. The objective of this excitation is to achieve a defined building sway in the two main directions of the tower. Based on numerical calculations it was found that a 240t TMD mass was required to achieve the required supplementary damping for the passive mode and to generate the required control force to achieve a tower top displacement of +/- 200 mm. To create a steady displacement level for the excitation mode and to suppress the displacements caused by wind and the forced vibration component in the perpendicular direction, a control algorithm was developed and tested with numerical simulations. After the installation of the passive pendulum type TMD system for which prefabricated concrete slabs were used as reaction mass, the actuators were commissioned and initial tests have been performed. The tests revealed that the inherent damping of the tower was higher than anticipated but all relevant modes could be determined clearly. The active excitation mode of the building is working and could be tested although not to the full extent to derive all operation parameters since the building is not entirely completed yet. Due to the premature state of the building the passive TMD could not be adapted to the determined fundamental frequencies.
As soon as the TMD system has been adapted, further tests of the building will be performed that will also include tests regarding amplitude dependent damping and the integrity of the safety concept.
REFERENCES
[1] Wenzel,H.,Pichler,D.,Schedler,R. (1991). „Ambiente Schwingungsmessungen zur System und Schadenserkennung an Tragwerken“, Bauingenieur 74
[2] Döhler, M. ,Andersen, P.: Mevel, L. (2012). “Operational Modal Analysis using a Fast Stochastic Subspace Identification Method”, Conference Proceedings of the Society for Experimental Mechanics Series
[3] Soong, T.T., Spencer, J.R. (2000). “Active, Semi-Active and hybrid control of structures” In 12th World Conference for Earthquake Engineering
[4] Ricciardelli, F.; Pizzimenti, A.D.; Mattei, M. (2003). Passive and active mass damper control of the response of tall buildings to wind gustiness. Eng. Struct., 25, 1199–1209
[5] Yang, N.Y.; Agrawal, A.K.; Samali, B.; Wu, J.C. Benchmark Problem for Response Control of Wind-Excited Tall Buildings. J. Eng. Mech. 2004, 130, 437–446.
[6] Watakabe, M.; Tohdp, M.; Chiba, O.; Izumi, N.; Ebisawa, H.; Fujita, T. Response control performance of a hybrid mass damper applied to a tall building. Earthq. Eng. Struct. Dyn. 2001, 30, 1655–1676.
[7] Tan, P.; Liu, Y.; Zhou, F.; Teng, J. Hybrid Mass Dampers for Canton Tower. CTBUH J. 2012, 24–29.
[8] Soong, T.T. “Active Structural Control: Theory and Practice”; John Wiley & Sons, Inc.: New York, NY, USA, 1990
[9] Preumont, A., Kazuto, S. (2008).”Active Control of Structures”, Wiley, Padstow
Share this post


Further Resources
You need further information on this topic?
Please do not hesitate to contact us with your individual question.
One of our project engineers will get back to you shortly.
Case Study on the Damping Technologies for tall Buildings: Comfort and Safety
Council on Tall Buildings and Urban Habitat (CTBUH) Damping System Guidelines
Thyssen Krupp Test Tower, Rottweil/Germany
Project Data
- Year of Completion:
2016(topped out) - Developer/Contractor/Owner:
Krupp Hoesch Stahl GmbH / Thyssen Krupp Elevators - Architectural Designer:
Werner Sobek with JAHN Architects Stuttgart and Chicago - Structural Designer:
Werner Sobek Stuttgart - Damping Supplier:
GERB Vibration Control Systems - Testing Laboratory:
Wacker Ingenieure (Wind Engineering / Wind Tunnel Tests) - Height / Interstory Height:
246 m / 3.3 m (Office Space) - Stories:
27 Levels / 8 Stories Office Space - Gross Area of the Tower:
340 square meters - Building Function:
Elevator Test Tower / Offices / Observation Platform ( 232 m) - Damping Strategy Utilized:
Hybrid Mass Damper System (240 t)
- Structural Material:
Reinforced Concrete (C50/60) / PTFE Membrane Façade on a steel structure - Structural System:
Cantilevered Reinforced Concrete Core on a Raft Foundation
(- 32 m)
Case Study on the Damping Technologies for tall Buildings: Comfort and Safety
Council on Tall Buildings and Urban Habitat (CTBUH) Damping System Guidelines
Thyssen Krupp Test Tower, Rottweil/Germany
Project Data
- Year of Completion: 2016(topped out)
- Developer/Contractor/Owner: Krupp Hoesch Stahl GmbH / Thyssen Krupp Elevators
- Architectural Designer: Werner Sobek with JAHN Architects Stuttgart and Chicago
- Structural Designer: Werner Sobek Stuttgart
- Damping Supplier: GERB Vibration Control Systems
- Testing Laboratory: Wacker Ingenieure (Wind Engineering / Wind Tunnel Tests)
- Height / Interstory Height: 246 m / 3.3 m (Office Space)
- Stories: 27 Levels / 8 Stories Office Space
- Gross Area of the Tower: 340 square meters
- Building Function: Elevator Test Tower / Offices / Observation Platform ( 232 m)
- Structural Material: Reinforced Concrete (C50/60) / PTFE Membrane Façade on a steel structure
- Structural System: Cantilevered Reinforced Concrete Core on a Raft Foundation (- 32 m)
- Damping Strategy Utilized: Hybrid Mass Damper System (240 t)
1.0 Introduction/History
A 246m tall tower has been erected in South West Germany with the purpose to accommodate a testing facility for elevator innovations. The tower has a circular footprint with a diameter of 20 m and provides space for 9 testing elevator shafts, a fire service elevator and a glass panorama view elevator. In addition a 220m shift is provided to be used as mechanical lifting shaft to ensure the test programs.
The tower base has a diameter of 40 m to provide additional space for service facilities, a lobby and an education center. At a level of 232m an observation platform – Germanys highest – allows a spectacular view to the Black Forest and even the Alps on clear days.
2.0 Structural System
The structural system of the Test-Tower is basically a reinforced concrete tube with a diameter of 20.8 m that is clamped 30 meters into the surrounding soil (see Figure 2).Up to a level of 110 m the tube has a thickness of 40 cm and above of 25 cm.The soil, consisting of a Keuper layer and subjacent shell lime stone, provides a high bearing capacity so a pile foundation was not required. In addition to the clamping by the surrounding soil, the wider tower base structure provides additional lateral stiffness.
The internal stiffening of the concrete tube results mainly from the inner walls of the elevator shafts. Only at certain height levels prefabricated ceiling slabs were installed to allow an access to the lift shafts. Some of the lift shafts end at a level of 115 m and are covered by 40 cm thick long span floors which were casted in place. These floors are used for office space. Above a void space up to a level of 197m is used as a heat reservoir and for the TMD system. The top of the tower is used for office space and for the remaining lift shafts.
A distinctive feature of the Test-Tower is the textile façade which consists of a PTFE coated glass-fiber mesh. The aperture width of the mesh increases with the height of the building to increase translucency of the façade, decrease the density and weight of the material and for aerodynamic effects.
The spiral shape of the facade is meant to function as a Scruton spiral and the fabric itself helps to shade the concrete structure to avoid thermal induced stresses due to solar radiation. For the façade design and the choice of material aspects of the installation, the maintenance and durability as well as the wind loading had to be considered.
3.0 Construction Method
The construction of the Test-Tower was done in the following steps:
- Excavation of a 30 m circular construction pit for the tower base. The excavation and the shape were achieved by an initial blast. After the excavation, the pit was secured with ground anchors and shotcrete lining.
- Pouring of the raft foundation
- Construction of the vertical concrete structure using slip forming. All walls were constructed continuously for a period of 4 months
- Construction of the floor slabs
- Construction of the entrance area.
4.0 Predicted Dynamic Response to wind loading
The fundamental frequencies for the Test-Tower were predicted to be in range of 0.17Hz – 0.20 Hz seconds depending on the construction stage and state of the concrete (cracked/uncracked) – see Figure 4.
The wind analysis revealed that resonant excitation of the structure can occur at wind speeds which correspond to ground values (height 10m) in the range of 55 – 60 km/h. It was expected that without additional damping this resonant excitation would cause top deflections of about +/- 750 mm which would not only cause discomfort for the occupants but would also have significant fatigue life implications for the concrete structure of the tower (see Figure 5 ). To reduce the dynamic response to cross wind excitation, a passive Tuned Mass Damper System was implemented. Since the tower shall be used as a test tower for building sway sensitive elevator equipment, the owner was looking for a possibility to artificially excite the tower on calm days, though with displacements that would not cause any fatigue issues. The requested level for the artificial sway motion was in the considered safe range of approximately +/- 200 mm. This request gave the rare opportunity to implement a Hybrid Mass Damper (HMD) or, since the design system deviates from other HMD systems that were introduced in the past, a so called Dual Use TMD. The system shall be presented in the following chapters, including the optimization of the passive system, the design of the actuators’ mechanism, control algorithms and the safety concept.
5.0 Optimization of the passive Tuned Mass Damper System
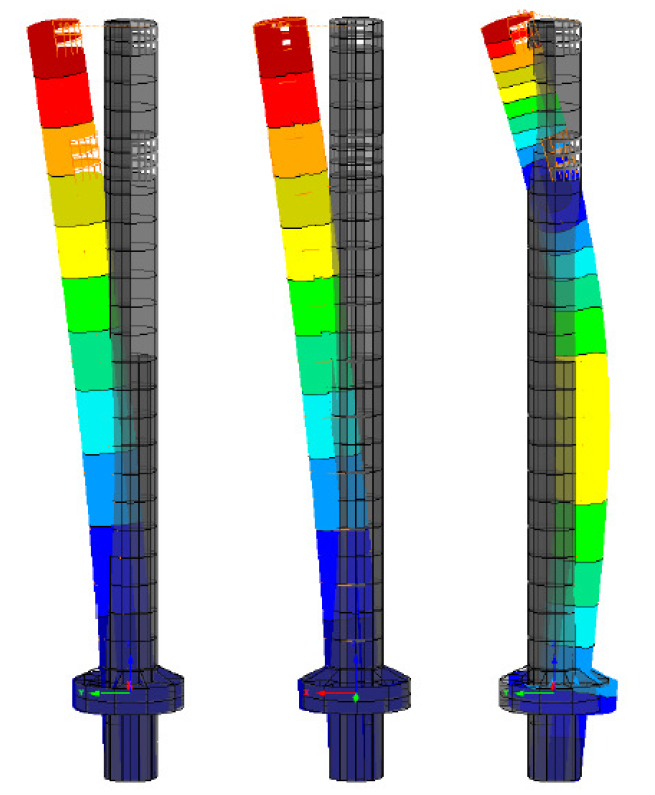
The parameters of the passive TMD system had to be determined considering three different aspects a) to provide sufficient additional structural damping in order to reduce the dynamic response owing to vortex shedding excitation, b) to limit the resulting TMD main mass travel in the passive mode, to an attainable/practical value, for when under gust cross wind excitation and c) to choose the TMD mass according to the energy input that is required for the desired maximum tower deflection in the excitation mode, considering the performance envelope enabled by the provided actuators (i.e. maximum force generated and maximum stroke during operation). To optimize the TMD system a numerical model was used that represented the mass distribution of the tower, and mass moments of inertia as reported in the identified structural properties. The stiffness elements between the floors were also tailored to match the mode shapes and natural frequencies from full-scale observations. Fig. 6-left shows the mode shapes and natural frequencies of this employed analogous model. Fig. 6-left also compares the mode shapes of the analogous model against these of the detailed model prepared by the structural consultant.
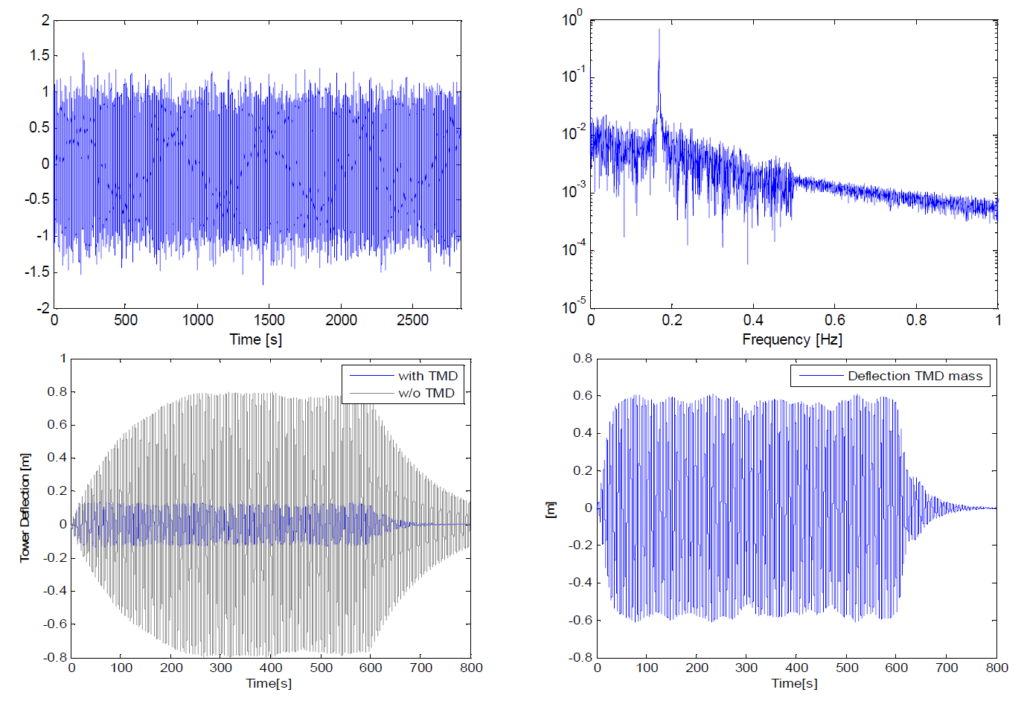
In addition, the TMD has been discretely modeled as a pendulum system capturing also its eccentric position at the tower. The load characteristics for the governing input case, i.e. resonant excitation due to vortex shedding, are very alike to that of a single harmonic excitation. Yet, the co-existing gust loading is inherently of stochastic nature and for it, optimization criteria other than the well known Den Hartog criterion apply. In addition, the relative displacements of the TMD mass are bigger for a stochastic than for a harmonic type loading. Since for the numerical determination of the optimum TMD parameters a close to reality loading should be considered, a time history was generated that included both the stochastic gust loading (based on the Davenport Spectrum) and a superimposed resonant, vortex shedding like, component for representing the overall cross wind excitation (see Fig. 3-right). The tower deflection reduction that can be achieved with the optimized passive TMD system as well as the resulting TMD displacements are shown in Fig. 3-right.
Based on these results for an estimated inherent structural damping of ξ=0.8 %, it was determined that a TMD mass of 240t was required to keep the displacements within +/- 650 mm while maintaining an optimum TMD damping ratio for the best TMD performance. An increase of the TMD damping could have reduced the travel while the efficacy would still have been sufficient but this would have adversely affected the actuator force requirements. To determine the required forces for the optimum 240 t TMD setup the analogous model has also been used to verify that, with a maximum force of 40 kN from the actuators, tower deflections can be achieved in the range of +/- 200 mm. Fig. 4 shows the results of a time domain numerical simulation on the analogous numerical model; for this the resulting tower top deflections, the TMD mass deflections and the input active forces that cause them are displayed.
6.0 Description of the control system
The duality of the control system serves a) the purpose of an reduced energy consumption, while in normal passive operation, to reduce the occurring vibrations b) the purpose of reduced force requirements for the actuators, by using resonance effects in order to excite the main TMD mass for ultimately achieving the actual force demand. So, compared to other control systems (see Fig. 1) the actuators connect the main structure and the TMD mass but are not used to control the TMD mass directly as it would be the case for a typical Active Mass Driver/Damper system.
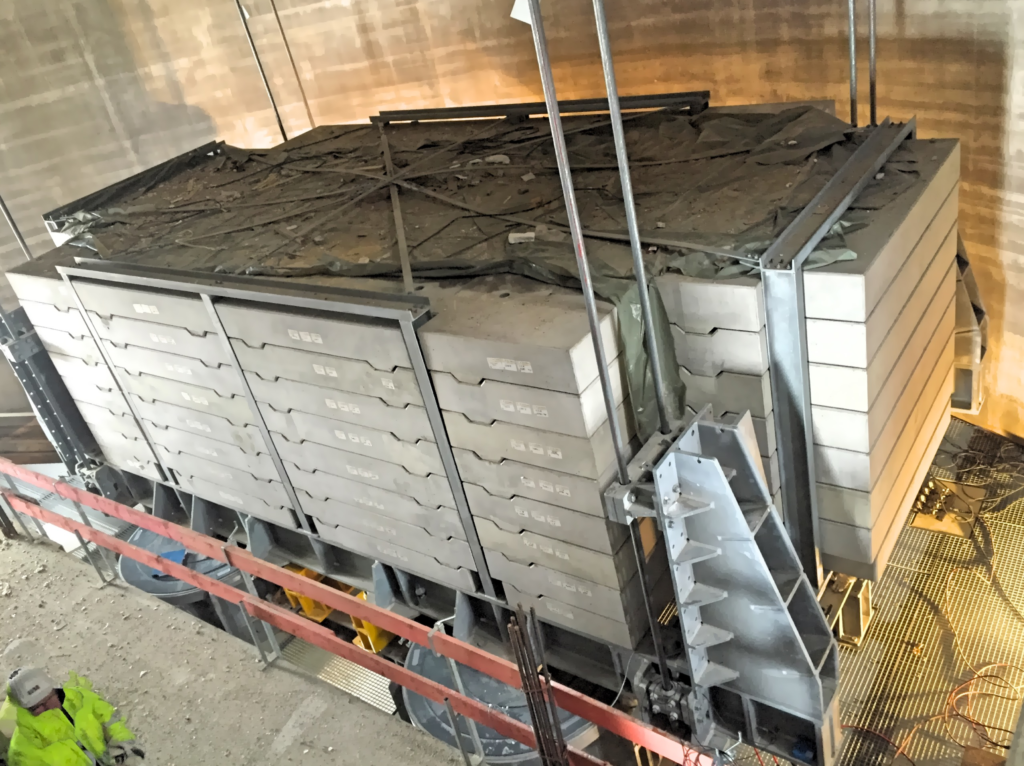
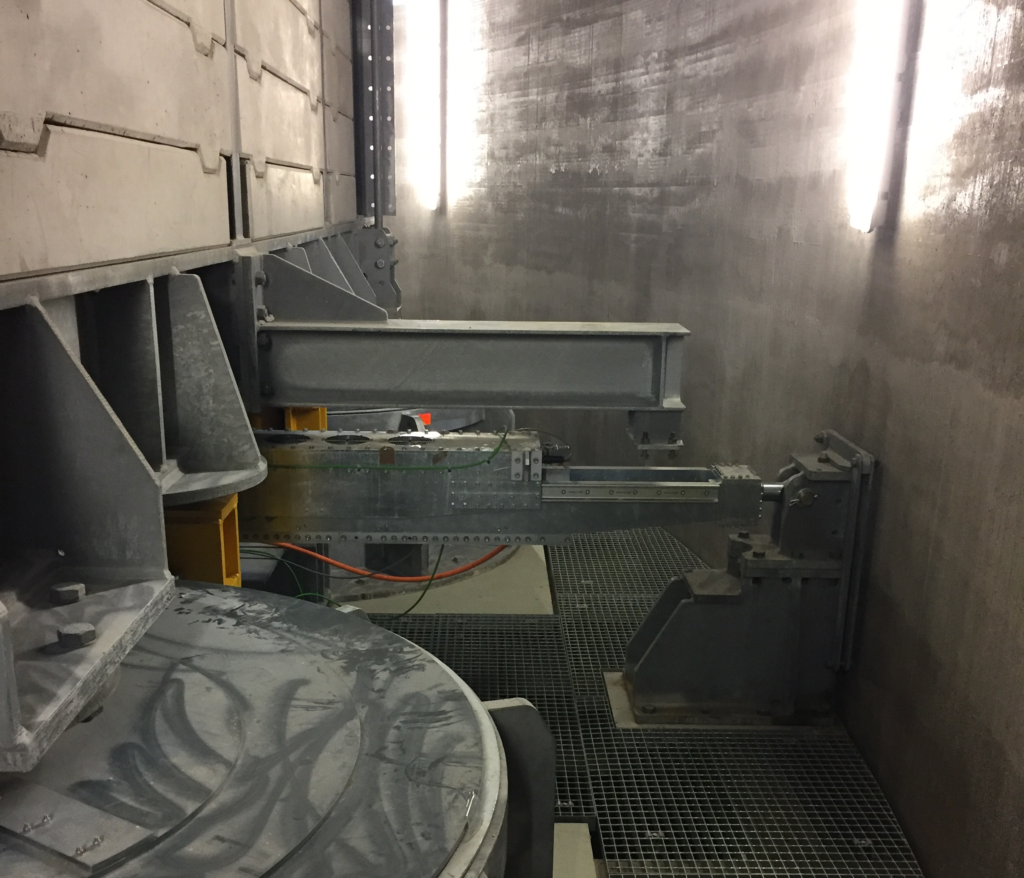
For the implemented Dual Use TMD a reaction mass for the passive operation of 240 tons was chosen. For the excitation operation mode two linear drives – one in each principal direction- are attached to the TMD mass with pivots near the center of gravity of the mass to avoid any torsional artefacts. Each linear drive can provide forces up to 40 kN within a stroke of max. +/- 600 mm (see detail Fig. 2). The linear drives can be detached so that the entire passive mode will not be influenced by the bearings of the actuators for the unlikely event of a bearing failure.
Figure 10 – Types of Control Systems – Dual Use TMD compared to passive, semi-active, active and hybrid systems
The system is instrumented with four uniaxial accelerometers (seismic K-Beam/MEMS; one in each direction) to determine the tower top level and the TMD mass accelerations. The acceleration signals are getting bandpass filtered inside the frequency range of the towers fundamental natural frequencies (0.1 – 0.3 Hz) and integrated to give the tower velocities and deflections.
In addition, the integrated displacement values can be compared against the ones of a complimentary Global Navigation Satellite System installed also at the top to compare for signal drifts. An initial correlation tests was performed accordingly. Furthermore, the TMD displacements are monitored directly with string pot transducers and an inductive length measuring system integrated within the linear motors.
7.0 Control algorithm
The general control loop for the tower is shown in Fig. 5 which illustrates the closed loop control sequence. A detailed design of the control algorithm would require analytical models of the actuators-TMD mass interaction to determine the connection between actuator input to applied action force. These should combine with the analytical model of the main structure that describes the overall building dynamic behavior. Further, compared to standard control algorithms that were applied to other HMD applications as in [2],[3] or theoretically investigated as in [1] the control algorithm for this tower application had to consider synchronous controlled excitation in one main direction and vibration reduction in the perpendicular direction. Since the dynamic response is majorly expected in the fundamental modes, linear feedback control with all its benefits to avoid instabilities could be applied for both these tasks. For the simple control realization practiced, the linear feedback control, that attenuates the towers dynamic response perpendicular to the excitation, drives the relevant actuator through a specified weighted linear sum of seven structural dynamic measurements. These measurements are: TMD and tower top accelerations, TMD and tower top velocities, TMD and tower top displacements, and TMD to tower top relative displacement.
It is important to note that the preselected weighting factors are simple, positive or negative scalar gains. The parametrization of the weighting factors is based on the dynamic tests of the tower and are not using any frequency dependent modification. The active actuator feedback is calculated instantaneously (at 50Hz), and it is again a linear combination of the previous dynamic measurements. There is no nonlinear manipulation being used. The control design was also implemented in a time domain numerical simulation (i.e. direct integration) to evidence the performance of the actuator control vibration mitigation. For the excitation mode the same control approach has been used in combination with a displacement offset that represents the excitation of the tower to the desired displacement value. The offset is a sinusoidal function based on the detected fundamental frequency of each direction. The control output to counteract the variation of the top displacement due to other disturbances is then modulated on the sinusoidal offset function and the control value is adapted accordingly.
The linear feedback control for reducing the towers dynamic response perpendicular to the excitation allows the force command to the actuator to be a specified weighted linear sum of the seven dynamic measurements of the program. The seven measurements are: TMD and tower acceleration, TMD and tower velocity, TMD and tower displacement, and TMD to tower relative displacement. It is important to note that the weighting factors are simple, positive or negative scalar values. The parametrization of the weighting factor is based on experimental dynamic tests of the tower. The actuator feedback is active is calculated instantaneously (50Hz)
and the weighting factors are scalars they are not using any form of frequency dependent transfer function. Also, the feedback is a linear combination of the dynamic property. There is no nonlinear manipulation or logic being used. The control design was implemented for a numerical simulation in the time domain (direct integration) so for each time step the force input to the TMD mass as actuator control could be adapted. Figure 12 shows the results from the simulation for vibration suppression – the tower displacements and the resulting travel of the TMD mass.
For the excitation mode the same control approach has been used in combination with an offset that represents the excitation of the tower to a desired displacement value. The offset is a sinusoidal function based on the detected fundamental frequency for each direction. The control output to counteract the variation of the top displacement due to the disturbance is then modulated on the sinusoidal offset
function and the control value has to be adapted accordingly. For this offset a weighting factor was experimentally determined. Figure 13 shows the numerical results with gust load disturbance for the excitation mode with a simple sinusoidal excitation and with applied control algorithm.
8.0 Safety concept
Considering the force of +/- 40 kN that can be provided by the linear drives that are used as actuators, a safety concept to ensure that the tower displacements do not exceed the fatigue provisions is indispensable. This applies even though the force output is not sufficient to cause top deflections larger than the predetermined +/-200 mm. One approach to enhance the safety of the system was to increase the redundancy of the monitoring sensors which are recording the tower’s top deflection. This can be best achieved by implementing an additional independent monitoring system that ideally uses a different measuring principal than the actual control hardware. For the herein presented project, the control hardware used, as quoted, accelerometers and a defined acceleration threshold for signal band-pass filtering within the range of the structure’s relevant natural frequencies. The overriding superordinate monitoring system is a Global Navigation Satellite System (GNSS) with an accuracy of +/- 10 mm. The GNNS system requires a reference base station, which is processing the coordinate data to the actual displacement response values. If the tower’s top displacement exceeds a predetermined threshold during the artificial excitation mode, which could owe to additional wind or other excitation, a relay will switch the attendance signal to 0V. This will cause aborting the excitation mode. In addition, both monitoring systems are constantly checking the acquired data for faulty sensor signals which will also result in aborting the active excitation mode. The faulty acceleration/string pot signals will be detected by a spectral peak picking criterion – only if peak picking in a relevant range is possible it can be assumed that the sensors provide legitimate signals. While the GNNS system analyzes the change of the coordinate data, if the sampled data do not timely change, a faulty signal is automatically assumed.
9.0 Vibration Tests
Initial vibration tests of the tower were performed at the current stage where the tower is not completed yet so the fundamental frequencies of the tower at this stage are above the specified tuning range of the passive TMD system. The TMD is adjusted to the highest possible tuning frequency. Objective of the vibration tests was the determination of the fundamental frequencies of the tower with blocked TMD system as well as the inherent structural damping. In addition the dynamic behavior with engaged passive TMD system should be determined as well as the increase of structural damping due to the passive TMD system. To identify the fundamental natural frequencies of the tower the Averaged Normalized Power Spectral Density (ANPSD) Method [1] can be used. For this, the recorded time histories have to be separated into segments. These segments have to be transformed into the frequency domain. The resulting spectra need to be normalized, averaged and multiplied with the complex conjugated spectra.
By doing so, all random vibration will be eliminated and only the recurring free vibrations of the structure will be displayed in the averaged spectrum, which now represents the dominantly excited natural frequencies of the tower. Figure 14 left shows the recorded time histories of the horizontal ambient vibrations in x- and y- directions with locked TMD. Figure 14 right shows the resulting averaged Auto Power Spectra for a segment length of 120 seconds. The spectra show that the tower shows a dynamic response at two dominant frequencies (0.225 Hz in x-direction and 0.245 Hz in y-direction).
Further to the above described Averaged Power Spectrum Method – which assumes that the ambient excitation causes a sufficient dynamic response in the vibration modes of interest to gain stochastic security- the natural frequencies were determined using the commercial signal processing software ARTEMIS [1] which incorporates Enhanced Frequency Domain Decomposition and Stochastic Subspace Identification Methods.
The Enhanced Frequency Domain Decomposition (EFDD) and the Stochastic Subspace Identification are widely used techniques for output-only modal parameter identification.
The EFDD method relies on computation of response spectra. Long records are, therefore, required to keep low the error on spectrum estimation and to extract modal parameters in a reliable way. The stochastic subspace identification algorithm was applied to identify bridges using an output–only model. Stochastic Subspace Identification methods work in time domain and are based on a state space description of the dynamic problem. The system identification results at different model orders are compared to distinguish true structural modes from spurious modes in so-called stabilization diagrams. These diagrams are a popular way to select the identified system model, as the true structural modes tend to be stable for successive model orders, fulfilling certain stabilization criteria that are evaluated in an automated procedure. Figure 15 shows a resulting stability card for recorded ambient data, from which the relevant modes could be determined. The identified modes and the determined damping ratios for each mode in the state with locked TMD (left) and the engaged TMD (right) are shown in Figure 14 as well. An increase of the structural damping can be noticed. The additional structural damping is in range of a theoretical value that can be determined from the theoretical model for which the detuned TMD setup was considered.
In addition to the ambient vibration tests with the passive TMD system, preliminary tests with the active excitation mode were performed despite the detuned state of the TMD system. Figure 12 left shows the time history of the recorded accelerations at the tower top. After an initial sinusoidal excitation the algorithm for a steady acceleration level was enabled to experimentally determine the correlation between tower deflection and forced displacement of the TMD mass. The time history shown in Figure 12 displays the two test scenarios in the excitation mode and the corresponding FFT spectra shows the clear response of the tower in its two fundamental frequencies (x- and y- direction). The green marked time section is a sinusoidal excitation of the mass with disabled active control which caused a dynamic response in both main directions. The resulting FFT spectrum displays the two peaks to identify the fundamental frequencies in these two directions. The blue marked time segment is for an excitation with enabled active control which caused a more steady tower displacement dominantly in one direction. The resulting vibration decay after the excitation mode was switched off was also used to determine the structural damping and determined to be D=2.4%. This result correlates with the damping ratio determined with the SSI algorithms.
10.0 Conclusion and Outlook
A Dual Use TMD has been installed at the 246m tall Thyssen Krupp Test-Tower with the objective to purposely excite the tower to a controlled dynamic response in its fundamental frequencies. The objective of this excitation is to achieve a defined building sway in the two main directions of the tower. Based on numerical calculations it was found that a 240t TMD mass was required to achieve the required supplementary damping for the passive mode and to generate the required control force to achieve a tower top displacement of +/- 200 mm. To create a steady displacement level for the excitation mode and to suppress the displacements caused by wind and the forced vibration component in the perpendicular direction, a control algorithm was developed and tested with numerical simulations. After the installation of the passive pendulum type TMD system for which prefabricated concrete slabs were used as reaction mass, the actuators were commissioned and initial tests have been performed. The tests revealed that the inherent damping of the tower was higher than anticipated but all relevant modes could be determined clearly. The active excitation mode of the building is working and could be tested although not to the full extent to derive all operation parameters since the building is not entirely completed yet. Due to the premature state of the building the passive TMD could not be adapted to the determined fundamental frequencies.
As soon as the TMD system has been adapted, further tests of the building will be performed that will also include tests regarding amplitude dependent damping and the integrity of the safety concept.
REFERENCES
[1] Wenzel,H.,Pichler,D.,Schedler,R. (1991). „Ambiente Schwingungsmessungen zur System und Schadenserkennung an Tragwerken“, Bauingenieur 74
[2] Döhler, M. ,Andersen, P.: Mevel, L. (2012). “Operational Modal Analysis using a Fast Stochastic Subspace Identification Method”, Conference Proceedings of the Society for Experimental Mechanics Series
[3] Soong, T.T., Spencer, J.R. (2000). “Active, Semi-Active and hybrid control of structures” In 12th World Conference for Earthquake Engineering
[4] Ricciardelli, F.; Pizzimenti, A.D.; Mattei, M. (2003). Passive and active mass damper control of the response of tall buildings to wind gustiness. Eng. Struct., 25, 1199–1209
[5] Yang, N.Y.; Agrawal, A.K.; Samali, B.; Wu, J.C. Benchmark Problem for Response Control of Wind-Excited Tall Buildings. J. Eng. Mech. 2004, 130, 437–446.
[6] Watakabe, M.; Tohdp, M.; Chiba, O.; Izumi, N.; Ebisawa, H.; Fujita, T. Response control performance of a hybrid mass damper applied to a tall building. Earthq. Eng. Struct. Dyn. 2001, 30, 1655–1676.
[7] Tan, P.; Liu, Y.; Zhou, F.; Teng, J. Hybrid Mass Dampers for Canton Tower. CTBUH J. 2012, 24–29.
[8] Soong, T.T. “Active Structural Control: Theory and Practice”; John Wiley & Sons, Inc.: New York, NY, USA, 1990
[9] Preumont, A., Kazuto, S. (2008).”Active Control of Structures”, Wiley, Padstow
1.0 Introduction/ History
A 246m tall tower has been erected in South West Germany with the purpose to accommodate a testing facility for elevator innovations. The tower has a circular footprint with a diameter of 20 m and provides space for 9 testing elevator shafts, a fire service elevator and a glass panorama view elevator. In addition a 220m shift is provided to be used as mechanical lifting shaft to ensure the test programs.
The tower base has a diameter of 40 m to provide additional space for service facilities, a lobby and an education center. At a level of 232m an observation platform – Germanys highest – allows a spectacular view to the Black Forest and even the Alps on clear days.
2.0 Structural System
The structural system of the Test-Tower is basically a reinforced concrete tube with a diameter of 20.8 m that is clamped 30 meters into the surrounding soil (see Figure 2).Up to a level of 110 m the tube has a thickness of 40 cm and above of 25 cm.The soil, consisting of a Keuper layer and subjacent shell lime stone, provides a high bearing capacity so a pile foundation was not required. In addition to the clamping by the surrounding soil, the wider tower base structure provides additional lateral stiffness.
The internal stiffening of the concrete tube results mainly from the inner walls of the elevator shafts. Only at certain height levels prefabricated ceiling slabs were installed to allow an access to the lift shafts. Some of the lift shafts end at a level of 115 m and are covered by 40 cm thick long span floors which were casted in place. These floors are used for office space. Above a void space up to a level of 197m is used as a heat reservoir and for the TMD system. The top of the tower is used for office space and for the remaining lift shafts.
A distinctive feature of the Test-Tower is the textile façade which consists of a PTFE coated glass-fiber mesh. The aperture width of the mesh increases with the height of the building to increase translucency of the façade, decrease the density and weight of the material and for aerodynamic effects.
The spiral shape of the facade is meant to function as a Scruton spiral and the fabric itself helps to shade the concrete structure to avoid thermal induced stresses due to solar radiation. For the façade design and the choice of material aspects of the installation, the maintenance and durability as well as the wind loading had to be considered.
3.0 Construction Method
The construction of the Test-Tower was done in the following steps:
- Excavation of a 30 m circular construction pit for the tower base. The excavation and the shape were achieved by an initial blast. After the excavation, the pit was secured with ground anchors and shotcrete lining.
- Pouring of the raft foundation
- Construction of the vertical concrete structure using slip forming. All walls were constructed continuously for a period of 4 months
- Construction of the floor slabs
- Construction of the entrance area.
4.0 Predicted Dynamic Response to wind loading
The fundamental frequencies for the Test-Tower were predicted to be in range of 0.17Hz – 0.20 Hz seconds depending on the construction stage and state of the concrete (cracked/uncracked) – see Figure 4.
The wind analysis revealed that resonant excitation of the structure can occur at wind speeds which correspond to ground values (height 10m) in the range of 55 – 60 km/h. It was expected that without additional damping this resonant excitation would cause top deflections of about +/- 750 mm which would not only cause discomfort for the occupants but would also have significant fatigue life implications for the concrete structure of the tower (see Figure 5 ). To reduce the dynamic response to cross wind excitation, a passive Tuned Mass Damper System was implemented. Since the tower shall be used as a test tower for building sway sensitive elevator equipment, the owner was looking for a possibility to artificially excite the tower on calm days, though with displacements that would not cause any fatigue issues. The requested level for the artificial sway motion was in the considered safe range of approximately +/- 200 mm. This request gave the rare opportunity to implement a Hybrid Mass Damper (HMD) or, since the design system deviates from other HMD systems that were introduced in the past, a so called Dual Use TMD. The system shall be presented in the following chapters, including the optimization of the passive system, the design of the actuators’ mechanism, control algorithms and the safety concept.
5.0 Optimization of the passive Tuned Mass Damper System
The parameters of the passive TMD system had to be determined considering three different aspects a) to provide sufficient additional structural damping in order to reduce the dynamic response owing to vortex shedding excitation, b) to limit the resulting TMD main mass travel in the passive mode, to an attainable/practical value, for when under gust cross wind excitation and c) to choose the TMD mass according to the energy input that is required for the desired maximum tower deflection in the excitation mode, considering the performance envelope enabled by the provided actuators (i.e. maximum force generated and maximum stroke during operation). To optimize the TMD system a numerical model was used that represented the mass distribution of the tower, and mass moments of inertia as reported in the identified structural properties. The stiffness elements between the floors were also tailored to match the mode shapes and natural frequencies from full-scale observations. Fig. 6-left shows the mode shapes and natural frequencies of this employed analogous model. Fig. 6-left also compares the mode shapes of the analogous model against these of the detailed model prepared by the structural consultant.
In addition, the TMD has been discretely modeled as a pendulum system capturing also its eccentric position at the tower. The load characteristics for the governing input case, i.e. resonant excitation due to vortex shedding, are very alike to that of a single harmonic excitation. Yet, the co-existing gust loading is inherently of stochastic nature and for it, optimization criteria other than the well known Den Hartog criterion apply. In addition, the relative displacements of the TMD mass are bigger for a stochastic than for a harmonic type loading. Since for the numerical determination of the optimum TMD parameters a close to reality loading should be considered, a time history was generated that included both the stochastic gust loading (based on the Davenport Spectrum) and a superimposed resonant, vortex shedding like, component for representing the overall cross wind excitation (see Fig. 3-right). The tower deflection reduction that can be achieved with the optimized passive TMD system as well as the resulting TMD displacements are shown in Fig. 3-right. Based on these results for an estimated inherent structural damping of ξ=0.8 %, it was determined that a TMD mass of 240t was required to keep the displacements within +/- 650 mm while maintaining an optimum TMD damping ratio for the best TMD performance. An increase of the TMD damping could have reduced the travel while the efficacy would still have been sufficient but this would have adversely affected the actuator force requirements. To determine the required forces for the optimum 240 t TMD setup the analogous model has also been used to verify that, with a maximum force of 40 kN from the actuators, tower deflections can be achieved in the range of +/- 200 mm. Fig. 4 shows the results of a time domain numerical simulation on the analogous numerical model; for this the resulting tower top deflections, the TMD mass deflections and the input active forces that cause them are displayed.
6.0 Description of the control system
The duality of the control system serves a) the purpose of an reduced energy consumption, while in normal passive operation, to reduce the occurring vibrations b) the purpose of reduced force requirements for the actuators, by using resonance effects in order to excite the main TMD mass for ultimately achieving the actual force demand. So, compared to other control systems (see Fig. 1) the actuators connect the main structure and the TMD mass but are not used to control the TMD mass directly as it would be the case for a typical Active Mass Driver/Damper system. For the implemented Dual Use TMD a reaction mass for the passive operation of 240 tons was chosen. For the excitation operation mode two linear drives – one in each principal direction- are attached to the TMD mass with pivots near the center of gravity of the mass to avoid any torsional artefacts. Each linear drive can provide forces up to 40 kN within a stroke of max. +/- 600 mm (see detail Fig. 2). The linear drives can be detached so that the entire passive mode will not be influenced by the bearings of the actuators for the unlikely event of a bearing failure.
The system is instrumented with four uniaxial accelerometers (seismic K-Beam/MEMS; one in each direction) to determine the tower top level and the TMD mass accelerations. The acceleration signals are getting bandpass filtered inside the frequency range of the towers fundamental natural frequencies (0.1 – 0.3 Hz) and integrated to give the tower velocities and deflections. In addition, the integrated displacement values can be compared against the ones of a complimentary Global Navigation Satellite System installed also at the top to compare for signal drifts. An initial correlation tests was performed accordingly. Furthermore, the TMD displacements are monitored directly with string pot transducers and an inductive length measuring system integrated within the linear motors.
7.0 Control algorithm
The general control loop for the tower is shown in Fig. 5 which illustrates the closed loop control sequence. A detailed design of the control algorithm would require analytical models of the actuators-TMD mass interaction to determine the connection between actuator input to applied action force. These should combine with the analytical model of the main structure that describes the overall building dynamic behavior. Further, compared to standard control algorithms that were applied to other HMD applications as in [2],[3] or theoretically investigated as in [1] the control algorithm for this tower application had to consider synchronous controlled excitation in one main direction and vibration reduction in the perpendicular direction. Since the dynamic response is majorly expected in the fundamental modes, linear feedback control with all its benefits to avoid instabilities could be applied for both these tasks. For the simple control realization practiced, the linear feedback control, that attenuates the towers dynamic response perpendicular to the excitation, drives the relevant actuator through a specified weighted linear sum of seven structural dynamic measurements. These measurements are: TMD and tower top accelerations, TMD and tower top velocities, TMD and tower top displacements, and TMD to tower top relative displacement. It is important to note that the preselected weighting factors are simple, positive or negative scalar gains. The parametrization of the weighting factors is based on the dynamic tests of the tower and are not using any frequency dependent modification. The active actuator feedback is calculated instantaneously (at 50Hz), and it is again a linear combination of the previous dynamic measurements. There is no nonlinear manipulation being used. The control design was also implemented in a time domain numerical simulation (i.e. direct integration) to evidence the performance of the actuator control vibration mitigation. For the excitation mode the same control approach has been used in combination with a displacement offset that represents the excitation of the tower to the desired displacement value. The offset is a sinusoidal function based on the detected fundamental frequency of each direction. The control output to counteract the variation of the top displacement due to other disturbances is then modulated on the sinusoidal offset function and the control value is adapted accordingly.
The linear feedback control for reducing the towers dynamic response perpendicular to the excitation allows the force command to the actuator to be a specified weighted linear sum of the seven dynamic measurements of the program. The seven measurements are: TMD and tower acceleration, TMD and tower velocity, TMD and tower displacement, and TMD to tower relative displacement. It is important to note that the weighting factors are simple, positive or negative scalar values. The parametrization of the weighting factor is based on experimental dynamic tests of the tower. The actuator feedback is active is calculated instantaneously (50Hz) and the weighting factors are scalars they are not using any form of frequency dependent transfer function. Also, the feedback is a linear combination of the dynamic property. There is no nonlinear manipulation or logic being used. The control design was implemented for a numerical simulation in the time domain (direct integration) so for each time step the force input to the TMD mass as actuator control could be adapted. Figure 12 shows the results from the simulation for vibration suppression – the tower displacements and the resulting travel of the TMD mass.
For the excitation mode the same control approach has been used in combination with an offset that represents the excitation of the tower to a desired displacement value. The offset is a sinusoidal function based on the detected fundamental frequency for each direction. The control output to counteract the variation of the top displacement due to the disturbance is then modulated on the sinusoidal offset function and the control value has to be adapted accordingly. For this offset a weighting factor was experimentally determined. Figure 13 shows the numerical results with gust load disturbance for the excitation mode with a simple sinusoidal excitation and with applied control algorithm.
8.0 Safety concept
Considering the force of +/- 40 kN that can be provided by the linear drives that are used as actuators, a safety concept to ensure that the tower displacements do not exceed the fatigue provisions is indispensable. This applies even though the force output is not sufficient to cause top deflections larger than the predetermined +/-200 mm. One approach to enhance the safety of the system was to increase the redundancy of the monitoring sensors which are recording the tower’s top deflection. This can be best achieved by implementing an additional independent monitoring system that ideally uses a different measuring principal than the actual control hardware. For the herein presented project, the control hardware used, as quoted, accelerometers and a defined acceleration threshold for signal band-pass filtering within the range of the structure’s relevant natural frequencies. The overriding superordinate monitoring system is a Global Navigation Satellite System (GNSS) with an accuracy of +/- 10 mm. The GNNS system requires a reference base station, which is processing the coordinate data to the actual displacement response values. If the tower’s top displacement exceeds a predetermined threshold during the artificial excitation mode, which could owe to additional wind or other excitation, a relay will switch the attendance signal to 0V. This will cause aborting the excitation mode. In addition, both monitoring systems are constantly checking the acquired data for faulty sensor signals which will also result in aborting the active excitation mode. The faulty acceleration/string pot signals will be detected by a spectral peak picking criterion – only if peak picking in a relevant range is possible it can be assumed that the sensors provide legitimate signals. While the GNNS system analyzes the change of the coordinate data, if the sampled data do not timely change, a faulty signal is automatically assumed.
9.0 Vibration Tests
Initial vibration tests of the tower were performed at the current stage where the tower is not completed yet so the fundamental frequencies of the tower at this stage are above the specified tuning range of the passive TMD system. The TMD is adjusted to the highest possible tuning frequency. Objective of the vibration tests was the determination of the fundamental frequencies of the tower with blocked TMD system as well as the inherent structural damping. In addition the dynamic behavior with engaged passive TMD system should be determined as well as the increase of structural damping due to the passive TMD system. To identify the fundamental natural frequencies of the tower the Averaged Normalized Power Spectral Density (ANPSD) Method [1] can be used. For this, the recorded time histories have to be separated into segments. These segments have to be transformed into the frequency domain. The resulting spectra need to be normalized, averaged and multiplied with the complex conjugated spectra.
By doing so, all random vibration will be eliminated and only the recurring free vibrations of the structure will be displayed in the averaged spectrum, which now represents the dominantly excited natural frequencies of the tower. Figure 14 left shows the recorded time histories of the horizontal ambient vibrations in x- and y- directions with locked TMD. Figure 14 right shows the resulting averaged Auto Power Spectra for a segment length of 120 seconds. The spectra show that the tower shows a dynamic response at two dominant frequencies (0.225 Hz in x-direction and 0.245 Hz in y-direction).
Further to the above described Averaged Power Spectrum Method – which assumes that the ambient excitation causes a sufficient dynamic response in the vibration modes of interest to gain stochastic security- the natural frequencies were determined using the commercial signal processing software ARTEMIS [1] which incorporates Enhanced Frequency Domain Decomposition and Stochastic Subspace Identification Methods.
The Enhanced Frequency Domain Decomposition (EFDD) and the Stochastic Subspace Identification are widely used techniques for output-only modal parameter identification.
The EFDD method relies on computation of response spectra. Long records are, therefore, required to keep low the error on spectrum estimation and to extract modal parameters in a reliable way. The stochastic subspace identification algorithm was applied to identify bridges using an output–only model. Stochastic Subspace Identification methods work in time domain and are based on a state space description of the dynamic problem. The system identification results at different model orders are compared to distinguish true structural modes from spurious modes in so-called stabilization diagrams. These diagrams are a popular way to select the identified system model, as the true structural modes tend to be stable for successive model orders, fulfilling certain stabilization criteria that are evaluated in an automated procedure. Figure 15 shows a resulting stability card for recorded ambient data, from which the relevant modes could be determined. The identified modes and the determined damping ratios for each mode in the state with locked TMD (left) and the engaged TMD (right) are shown in Figure 14 as well. An increase of the structural damping can be noticed. The additional structural damping is in range of a theoretical value that can be determined from the theoretical model for which the detuned TMD setup was considered. In addition to the ambient vibration tests with the passive TMD system, preliminary tests with the active excitation mode were performed despite the detuned state of the TMD system. Figure 12 left shows the time history of the recorded accelerations at the tower top. After an initial sinusoidal excitation the algorithm for a steady acceleration level was enabled to experimentally determine the correlation between tower deflection and forced displacement of the TMD mass. The time history shown in Figure 12 displays the two test scenarios in the excitation mode and the corresponding FFT spectra shows the clear response of the tower in its two fundamental frequencies (x- and y- direction). The green marked time section is a sinusoidal excitation of the mass with disabled active control which caused a dynamic response in both main directions. The resulting FFT spectrum displays the two peaks to identify the fundamental frequencies in these two directions. The blue marked time segment is for an excitation with enabled active control which caused a more steady tower displacement dominantly in one direction. The resulting vibration decay after the excitation mode was switched off was also used to determine the structural damping and determined to be D=2.4%. This result correlates with the damping ratio determined with the SSI algorithms.
10.0 Conclusion and Outlook
A Dual Use TMD has been installed at the 246m tall Thyssen Krupp Test-Tower with the objective to purposely excite the tower to a controlled dynamic response in its fundamental frequencies. The objective of this excitation is to achieve a defined building sway in the two main directions of the tower. Based on numerical calculations it was found that a 240t TMD mass was required to achieve the required supplementary damping for the passive mode and to generate the required control force to achieve a tower top displacement of +/- 200 mm. To create a steady displacement level for the excitation mode and to suppress the displacements caused by wind and the forced vibration component in the perpendicular direction, a control algorithm was developed and tested with numerical simulations. After the installation of the passive pendulum type TMD system for which prefabricated concrete slabs were used as reaction mass, the actuators were commissioned and initial tests have been performed. The tests revealed that the inherent damping of the tower was higher than anticipated but all relevant modes could be determined clearly. The active excitation mode of the building is working and could be tested although not to the full extent to derive all operation parameters since the building is not entirely completed yet. Due to the premature state of the building the passive TMD could not be adapted to the determined fundamental frequencies.
As soon as the TMD system has been adapted, further tests of the building will be performed that will also include tests regarding amplitude dependent damping and the integrity of the safety concept.
REFERENCES
[1] Wenzel,H.,Pichler,D.,Schedler,R. (1991). „Ambiente Schwingungsmessungen zur System und Schadenserkennung an Tragwerken“, Bauingenieur 74
[2] Döhler, M. ,Andersen, P.: Mevel, L. (2012). “Operational Modal Analysis using a Fast Stochastic Subspace Identification Method”, Conference Proceedings of the Society for Experimental Mechanics Series
[3] Soong, T.T., Spencer, J.R. (2000). “Active, Semi-Active and hybrid control of structures” In 12th World Conference for Earthquake Engineering
[4] Ricciardelli, F.; Pizzimenti, A.D.; Mattei, M. (2003). Passive and active mass damper control of the response of tall buildings to wind gustiness. Eng. Struct., 25, 1199–1209
[5] Yang, N.Y.; Agrawal, A.K.; Samali, B.; Wu, J.C. Benchmark Problem for Response Control of Wind-Excited Tall Buildings. J. Eng. Mech. 2004, 130, 437–446.
[6] Watakabe, M.; Tohdp, M.; Chiba, O.; Izumi, N.; Ebisawa, H.; Fujita, T. Response control performance of a hybrid mass damper applied to a tall building. Earthq. Eng. Struct. Dyn. 2001, 30, 1655–1676.
[7] Tan, P.; Liu, Y.; Zhou, F.; Teng, J. Hybrid Mass Dampers for Canton Tower. CTBUH J. 2012, 24–29.
[8] Soong, T.T. “Active Structural Control: Theory and Practice”; John Wiley & Sons, Inc.: New York, NY, USA, 1990
[9] Preumont, A., Kazuto, S. (2008).”Active Control of Structures”, Wiley, Padstow
Share this post
Share this post
Further Resources
You need further information on this topic?
Please do not hesitate to contact us with your individual question.
One of our project engineers will get back to you shortly.
Further Resources
You need further information on this topic?
Please do not hesitate to contact us with your individual question.
One of our project engineers will get back to you shortly.